Enhancing Construction Reporting Efficiency with AI-Powered Power BI
Behind every beautiful facade adding to the skyline is a complex network of nitty-gritty involved.
According to a McKinsey survey, projects are prone to overrun costs and timelines by 30-45%. Handling a big project isn’t a breeze– owing to the multiple collaborations within the teams and coordination for front-line resources. Another significant challenge is a clear picture of what’s being executed on-site.
By the time the on-site information reaches the leaders, or they skim through tonnes of reports and PDFs, the level of progress and details at the site might have changed.
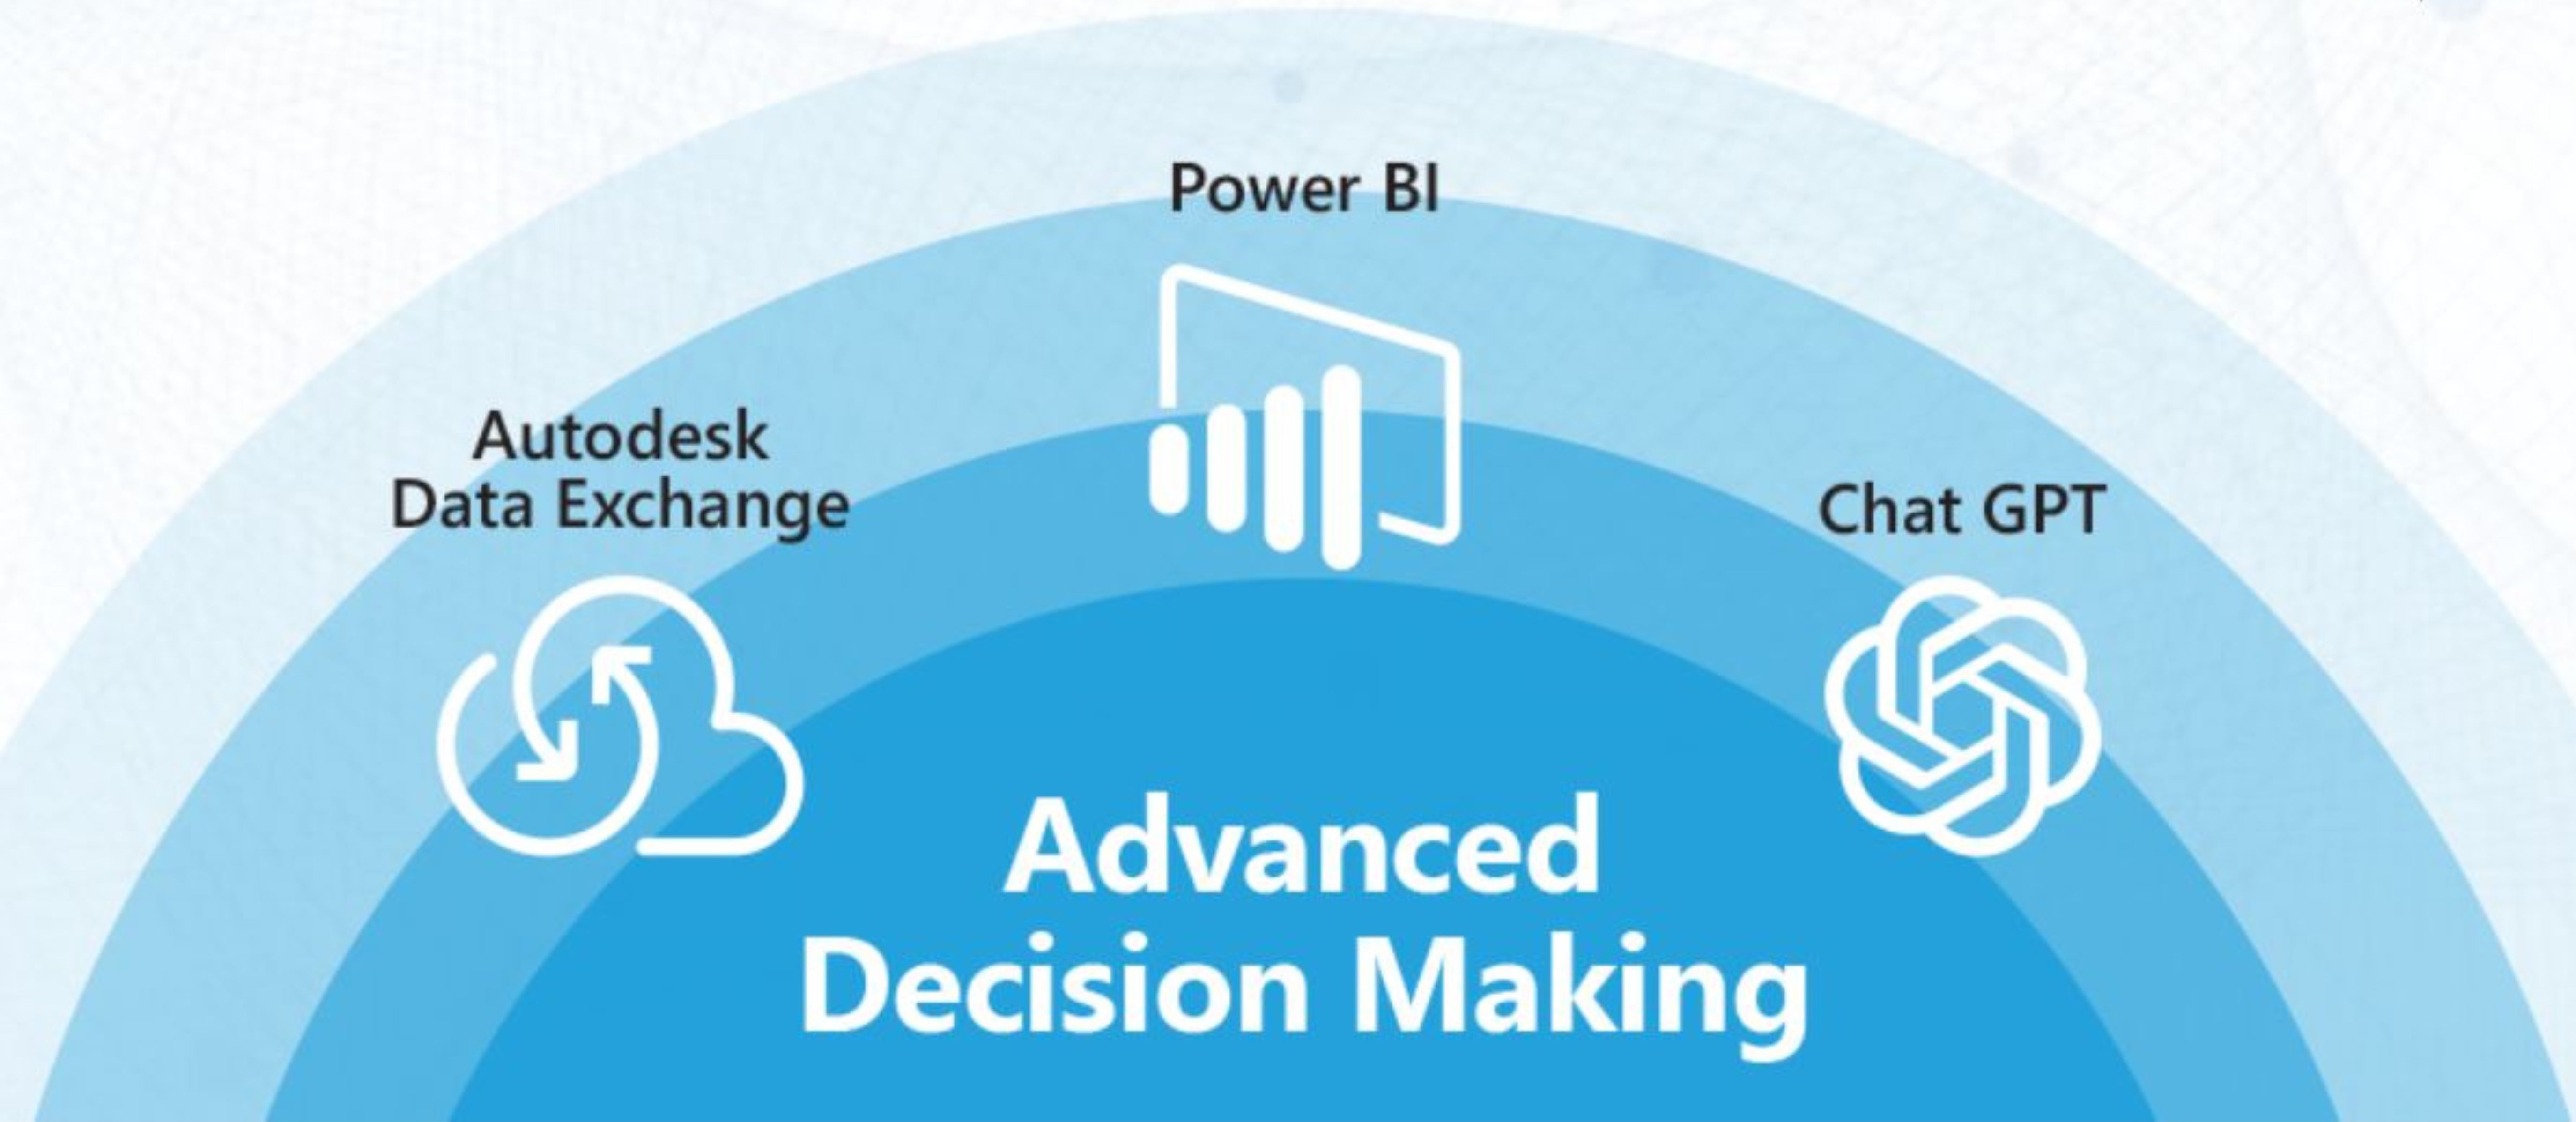
However, as the AEC industry opened the doors for technology, Power BI stepped in as a game-changer with a more practical approach to recording, visualising, conveying, and managing data. Furthermore, artificial intelligence has led to the evolution of project performance.
Today, data is everywhere—from simple WhatsApp messages to complex Word documents. Power BI makes it easier to digest complex information through visualisation. It lets you combine information, turn the insights into actions, and empower each team member.
And to make data visualisation even more ‘cool,’ here’s what AI brings to the Power BI table.
- Autopilot for Visualisation
You no longer have to enter every piece of information. Smart Data Discovery and Visualisation now automatically discover and visualise data for you.
- Spotting the Unusual Patterns
The AI-driven anomaly detection in Power BI detects unexpected patterns within the datasets– leaving you with the power to review and revise.
- Answering Questions with Natural Language Query (NLQ)
Got a question? Ask away! Power BI’s NLQ gets quick insights and answers from the fed data.
- Hey Siri!
The Mobile iOS application for Power BI is now embracing Siri shortcuts. You can say, ‘Hey Siri, open the construction report,’ and there you go with the content you need.
- Key Influencers
The key influencers feature helps you recognize and understand the factors driving the project. It analyses information, ranks the factors, and displays them as the key influencers.
Power BI in Construction Reporting
The development of AI, with its futuristic capabilities, has enabled automation to enter broader sectors. While AI can’t work with brick-and-mortar to construct high-rises, it can speed up AEC jobs.
Construction projects need rich information for execution. Stereotypically, Excel sheets have made quite an impact in the construction industry. But it’s time to ditch the laborious job of manually feeding information. Today, we must embrace fast-paced technology.
Let’s understand how Power BI is helping overcome the typical challenges of reporting.
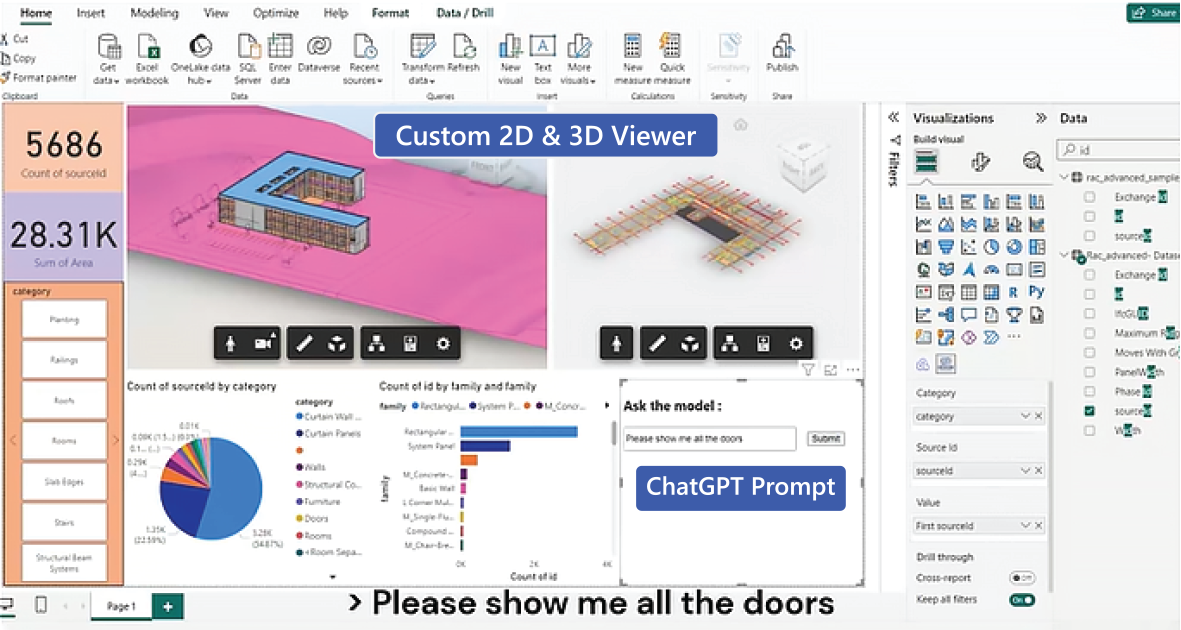
- Interactive Visualisation
Looking at hundreds of cells in an Excel sheet has never been exciting. Power BI adds interest to construction reports with visually appealing and interactive dashboards. The integration of graphs, maps, and charts helps highlight the key insights from the report. This modern tool makes it convenient to communicate critical information across teams.
- Informed Decisions
Information in construction reporting often comes in bits and pieces. The fragmented system leads to differentiated insights and sometimes poor decisions. Power BI, on the other hand, streamlines the data. Project managers can identify and highlight bottlenecks early and make informed decisions about appropriate actions. It helps in budgeting, scheduling, resource allocation, and enhanced project efficiency.
- Transparency is the Key!
A conventional approach doesn’t promise all the stakeholders to be on the same page. A lack of transparency leads to reporting issues for every team. As critical as it is to collect the data, it’s equally important to spread it.
Power BI offers easy access to the dashboards and reports for every stakeholder, promoting accountability and transparency in the process. This digital approach minimises the chances of miscommunication, keeping every stakeholder on track.
- Forecasting– What Next?
Artificial intelligence truly comes into the picture when predicting or defining a trend. Power BI transforms the data collected from multiple sources into forecasted trends. The predictive analysis offers cost control by highlighting the timeline and risks involved. Through these actionable insights, the stakeholders can plan workflows and timelines, promising efficiency in results.
- Goodbye, Human Errors!
Artificial intelligence in Power BI minimises manual calculations and data entry. The automated capabilities save the report from manual errors and enhance productivity. Further, real-time updates ensure that every team has the latest information at their fingertips, enabling collaborative decisions.
- Keeping the Project Healthy
Keep the information understandable rather than making stakeholders sift through pages of cluttered information. Power BI displays project-related data with engaging visuals like charts, maps, graphs, etc. It makes it easy to identify the lined-up schedule. Accordingly, the leaders can deploy or isolate the teams.
- Connecting and Orchestrating Supply Chain
Forget about robots actually constructing on-site. Instead, focus on what’s more vital—data. Ask AI to get you data and use it to make better decisions. AI is helping connect and manage supply chains amidst economic uncertainty and market volatility.
Today, supply chains are more accurate owing to digital interconnection. This eliminates guesswork and helps construction stakeholders accurately predict their material and construction schedules.
- Resource and Waste Optimisation
Power BI offers a single version of the truth with streamlined construction reports. Centralised data is used by every organisation’s stakeholders, offering better and more collaborative planning, procurement, and material management.
Further, it identifies patterns and inefficiencies in the usage. The derived trends help teams make appropriate decisions, saving resources and minimising wastage.
- Keeping the Work Conditions Safe
The team leaders can ensure site safety through construction reporting in Power BI. This helps them track safety incidents and adherence to codes and standards. Interactive dashboards can even track the progress of training and certifications.
- Personalised Dashboard
Report it your way! Power BI lets you customise the dashboard according to your preferences. You can generate data-rich and interactive reports using real-time visualisation. You can pick a dashboard theme with your preferred tones to make the otherwise dull task of construction reporting exciting.
Reports that Speak!
While Power BI is high-tech on its own, AI serves as the right fuel to level up the efficiency. Regarding construction reporting, Power BI is one of the most robust tools. It ensures transparency, safety, accuracy, and visual interest. The visualisations speak out loud for every minute update, meaning that AEC stakeholders can predict cost and schedule in no time for the project to perform better.