Power BI Dashboards & Helpdesks

Narrating Stories Through Visualisation… 


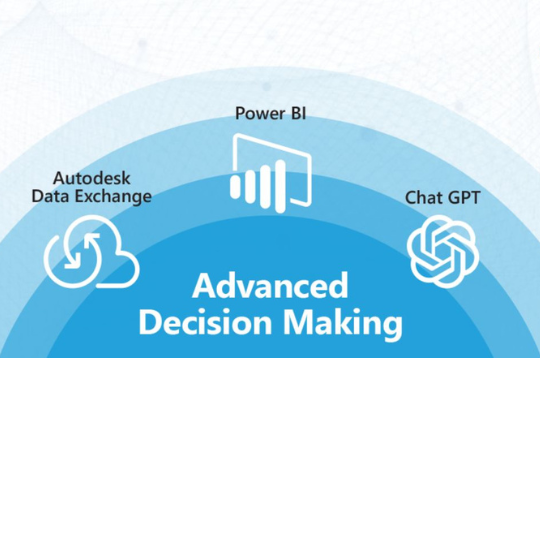
Transform data into decisions with interactive Power BI dashboards built for AEC, BIM & construction analytics. 


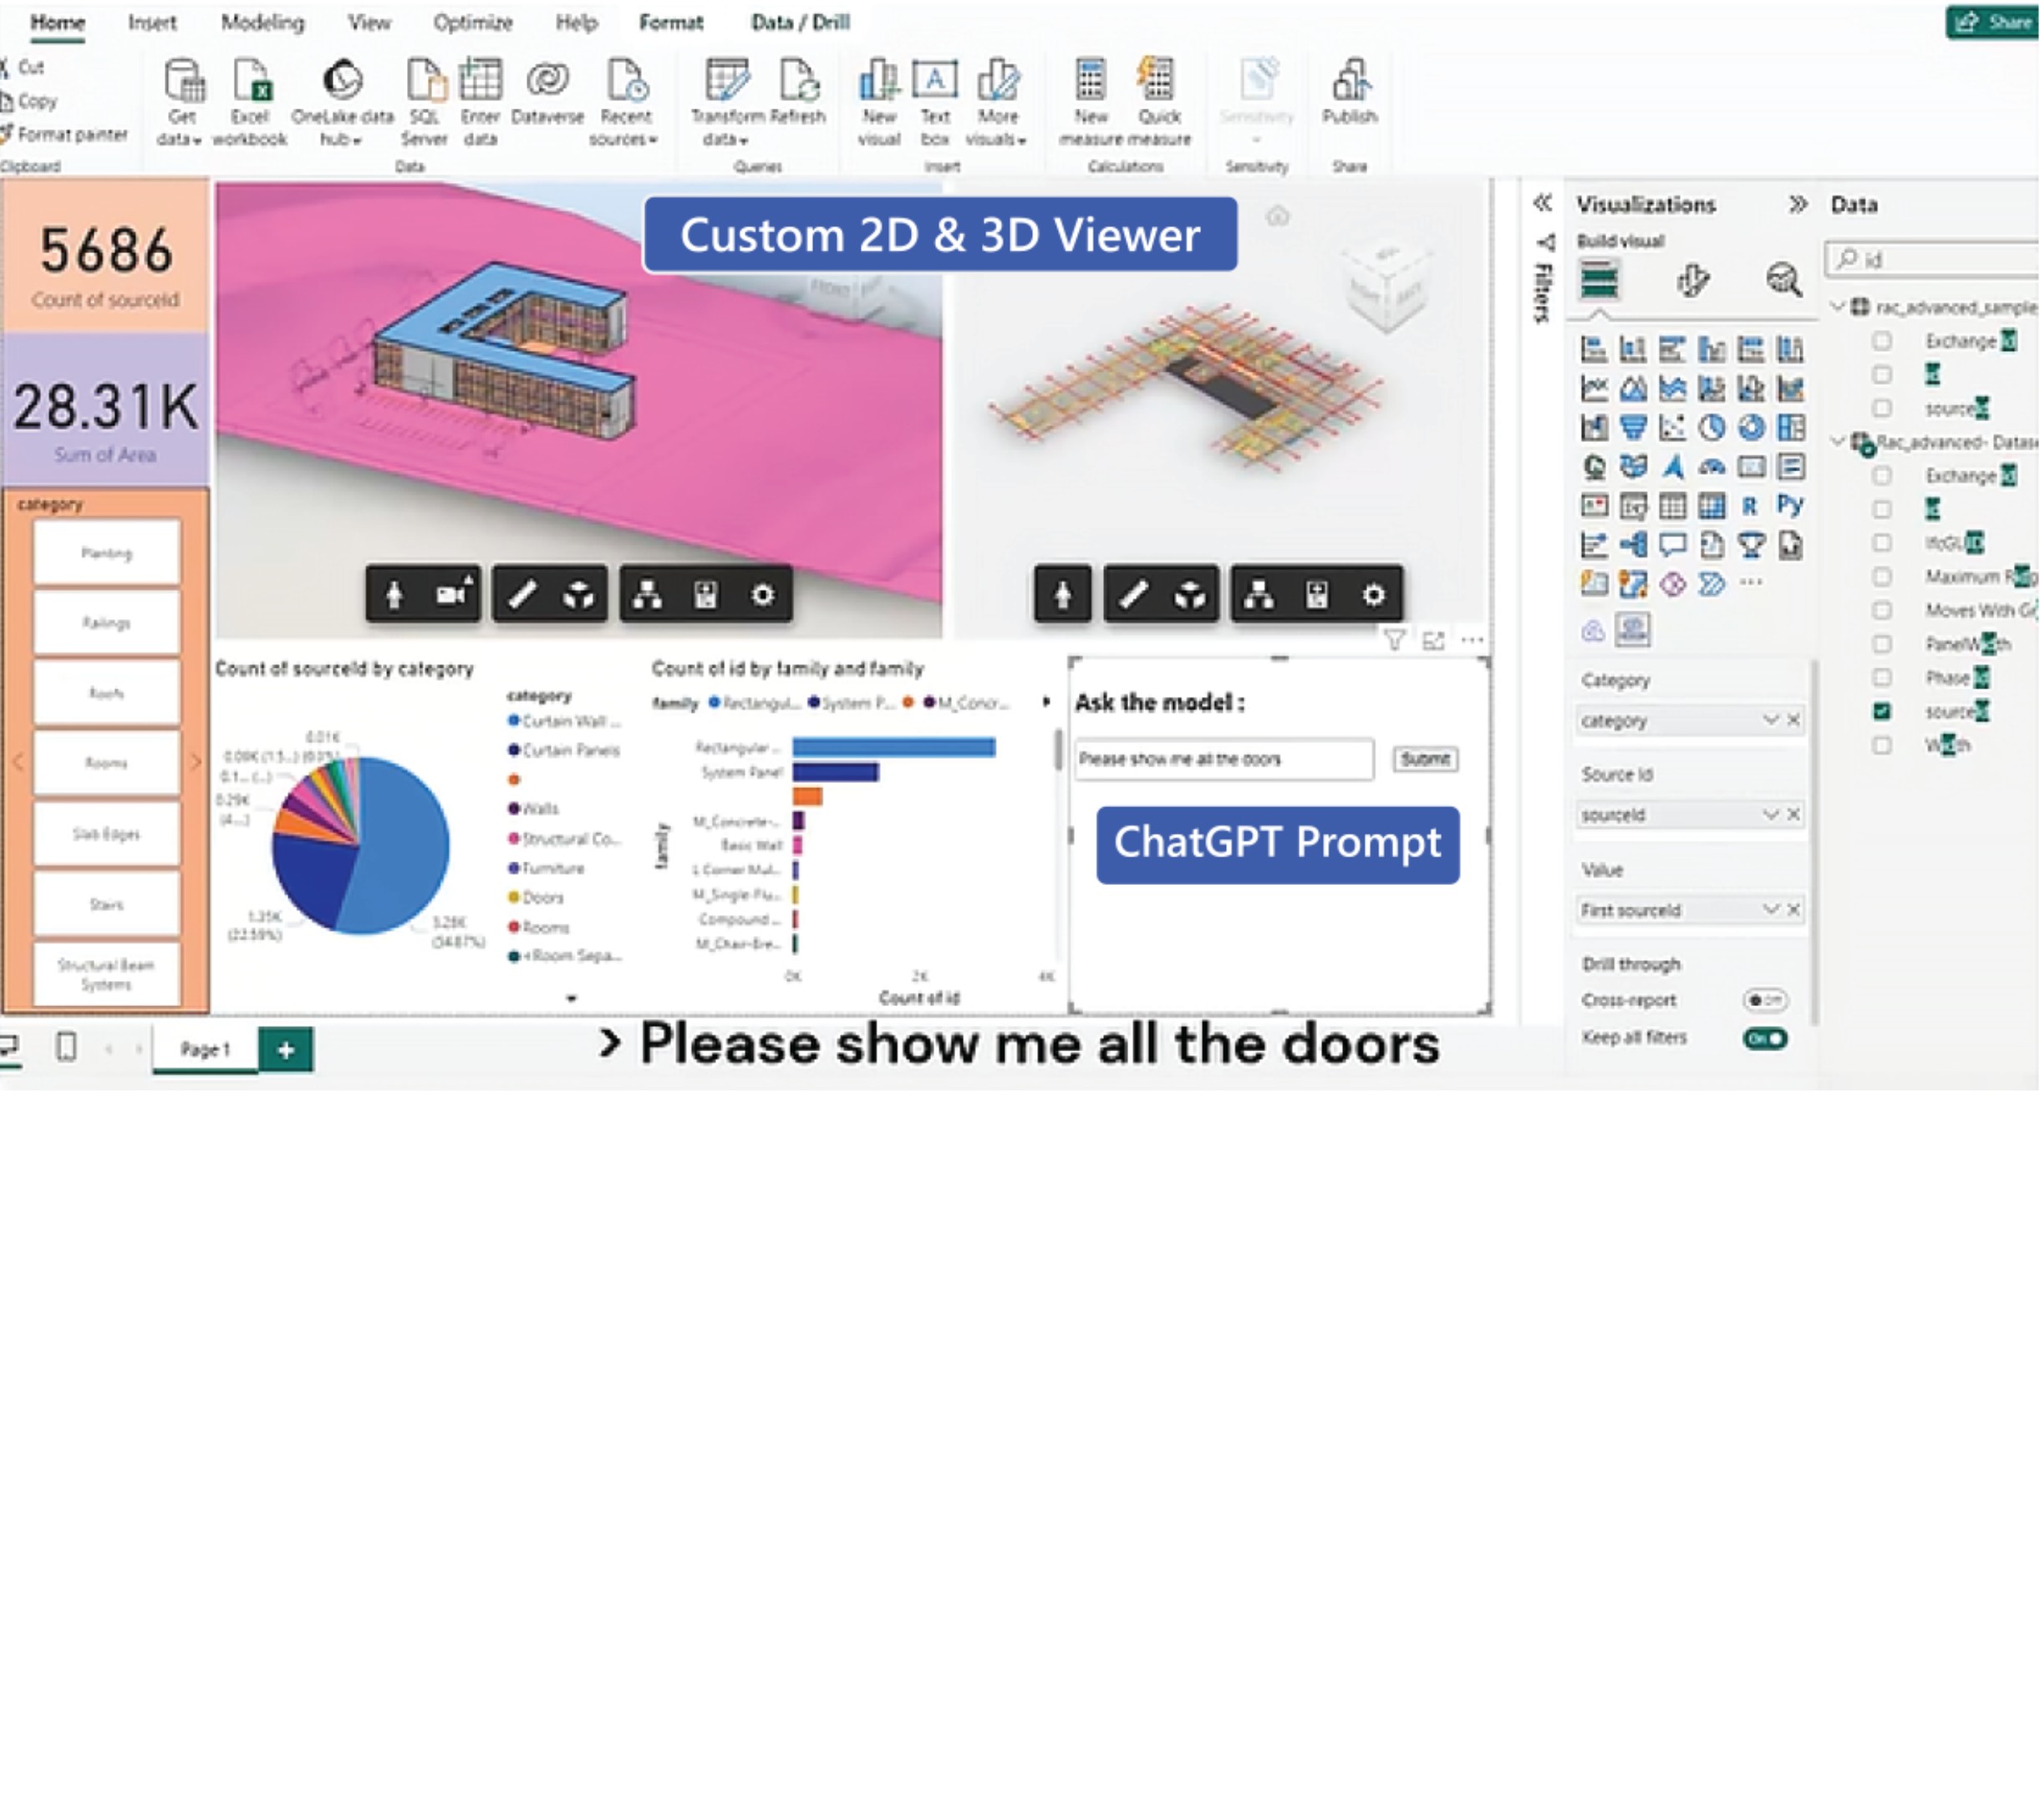
A Power BI Dashboard is a one-page visualisation that tells the story behind your data. 


It presents insights in a crisp, clear, and meaningful format—helping teams analyse, process, and visualise large project datasets effortlessly. 


In an era where information is abundant but clarity is rare, Power BI simplifies data storytelling by converting complexity into a single visual snapshot. 


This enables quick understanding, faster decisions, and improved collaboration across teams. 

Our Power BI Solutions for AEC

Seamless Data Integration

Connect BIM and project data from Revit, AutoCAD, IFC, Excel, ERP, Site Logs, IoT sensors and more into Power BI. Automated connectors eliminate manual reporting and bring data into one source of truth.

Bespoke, AI-Enhanced Dashboards

Dashboards crafted for CXOs, project managers, QS teams, design & site engineers. Our UI-driven visual storytelling ensures fast interpretation and measurable action.

Multi-Platform BI Expertise

Along with Power BI, we support Tableau & enterprise BI platforms—flexible for any architecture or workflow.

Unlock Data Intelligence for AEC with Power BI

Power BI transforms raw BIM and project data into visual stories, dashboards, KPIs and interactive insights


We turn complex BIM models, CDE data, site records & operational metrics into heatmaps, drill-downs, geospatial views and custom visuals—giving stakeholders real visibility and control. 


With custom dashboards & helpdesk support designed specifically for AEC, we streamline reporting, automate analytics, and enable smarter decision-making at every stage of the project lifecycle.


Where AEC Teams Use Power BI 


✔ Project Progress & Milestone Tracking 

✔ Budget, Cost & Financial Dashboards 

✔ Resource & Material Management 

✔ Health, Safety & Quality Analytics 

✔ BIM-Based Facility & Asset Management 

✔ Executive KPI & Performance Dashboards 

Why Choose Power BI for AEC?

Power BI empowers construction teams with real-time visibility, automation, and intuitive decision intelligence. It brings data together, simplifies monitoring, and turns project complexity into actionable insights.

  • Integrates & unifies diverse data sources
  • Customisable visuals & KPIs for any role
  • Simple interface for fast adoption
  • Automated refresh for live dashboards
  • Ideal for project control, reporting & governance

Testimonials

Bring clarity to your construction data with Power BI dashboards designed for AEC workflows.

Let’s build intelligent reporting, automation & visual analytics tailored to you.